Experimentation Program Metrics
When running your experimentation program properly, you need to keep a close eye on the metrics that can help you determine if your program is healthy or not.
An experimentation program is more than just running tests and there are lots of different moving parts including the people involved that you need to watch out for.
The most basic metrics that we have seen reported by experimentation teams are
- Number of Experiments per month / quarter/ year
- % of successful experiments / Uplift / Win rate
- Revenue
These are useful to track and show especially if those numbers are going up. But they don’t always paint the true picture of the health of the program.
Just like aggregate data in your analytics tool, it doesn’t tell you whats truly going on until you segment the data and analyse it properly.
In this blog post, we will show you the metrics you should be tracking along with the datapoints you must capture if you truly want to understand how to improve your experimentation program.
We have broken them down into two key parts that define the experimentation program
- Process
a. Health - Action
- People
a. Adoption & Activity
b. Engagement
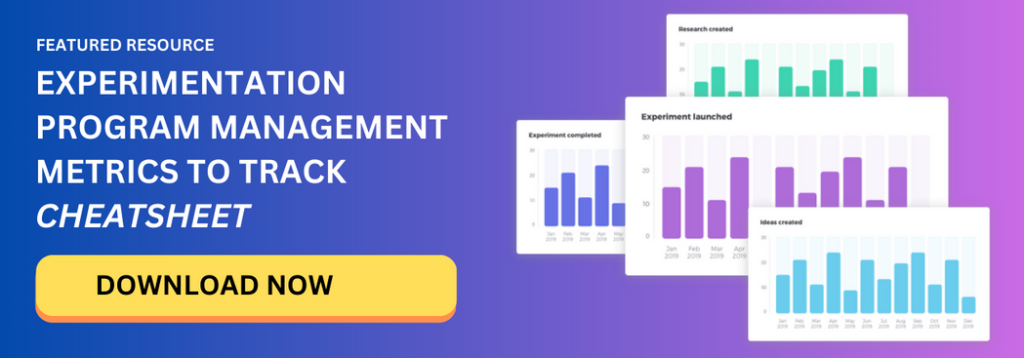
Want to download a cheatsheet of Experimentation Program Metrics
DOWNLOAD NOW
Process Metrics
An experiment is only reliable if the data going in and the way the output was analysed was following a rigorous process. Any shortcomings in this means that the data could easily be falsified or erroneous (whether consciously or unconsciously done)
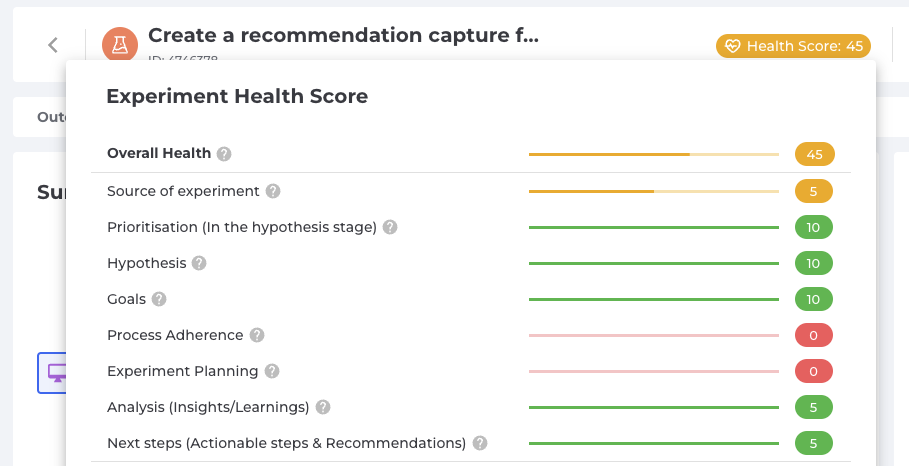
Health :Experiment Health Score
When CROs say they have run 50 experiments a month, it doesn’t really tell you much other than the number itself. No two experiments are alike in the real world. They will vary by complexity. They will be impacted by external factors such as dev timelines. They will vary in the quality of the hypothesis because of the maturity of the person or team launching that test.
Being able to evaluate each individual experiment and understand whether it was planned and executed correctly and more importantly analysed and reported on truthfully.
Tracking the process itself is really important with special attention given to the changes in the data and the process.
If your program has a governance framework established, you have to check manually or automatically whether this governance framework was adhered to.
The Experiment Health Score can score each experiment based on process adherence to the governance framework. The Health Score is unrelated to the success or failure of the test. Instead, it looks for all the key activities involved in planning a test – such as a good hypothesis, clear metrics- and analysing the test – all metrics selected are reported on, no cherry picking of data.
The health score of the experiment becomes the backbone of a trustworthy experimentation program and can help your organization prevent individuals from Hark-ing.
The health score can then be aggregated across teams or individuals to highlight areas where they can improve.
To track the health score, you must track these datapoints depending on your governance framework and guardrails.
- The Source – Where was this experiment idea generated from? Data driven? Ad-hoc? Senior management?
- The Hypothesis – What is the quality of the hypothesis? Was it changed at anypoint after the experiment was planned and launched.
- The Metrics – What metrics were picked during the experiment planning stages? Are they the same in the reporting stage? Did any metrics get added or removed?
- The Planning – Was this prioritized well in the ideation backlog? How well did this experiment stick to the plan? Did it cut corners? Were there delays in the start or end of the experiment? Was the experiment run for a shorter period of time to report on a significant result? or did they run it longer than needed?
- Errors – Did this experiment have any sample ratio mismatch or statistical errors?
Further Resources: Read our blog post on building an Experiment Scorecard
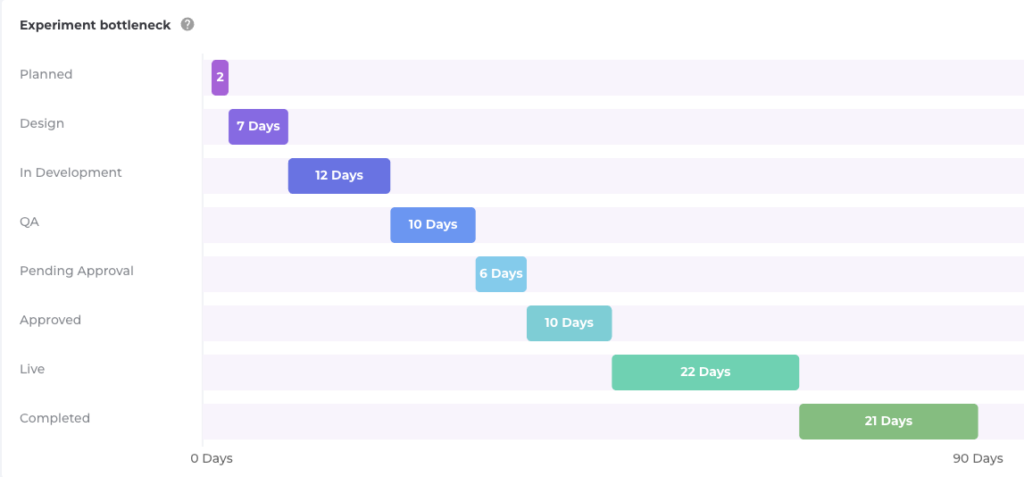
Health :Experiment Throughput & Bottlenecks
Throughput is defined as the amount of time an experiment takes from start to finish. From the inception of the idea all the way through to its reporting.
This metric can offer valuable insights into the bottlenecks within your experimentation program.
Whilst throughput can be calculated with just the start and end points, it makes more sense to track the individual steps in that journey.
It starts with defining all the steps in the journey.
If your process is simplistic like – Backlog / Running / Report, you’re unlikely to get a lot of valuable information.
Throughput on its own isn’t sufficient. This is where you need to be able to track the bottlenecks.
Start by breaking them into phases. Ideation & Experimentation.
Make it more granular by tracking the different steps in the ideation phase (backlog, prioritization) through to experiment planning (design, dev, qa, approvals) and post live (reporting and finalised). This will give a clear picture of where an experiment is getting stuck the most.
To capture this data correctly, you must ensure that the individuals involved update the system used to track experiments to reflect the real world.
Effective Experiments tracks these metrics and displays the Throughput and lag at each stage in the journey.

ACTION METRICS
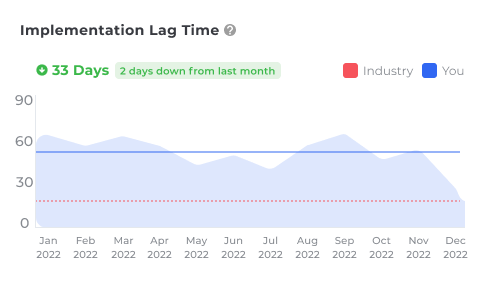
Action:Implementation Lag Time
Once an experiment is done and has shown an uplift or learnings that can be implemented into production, it goes into the engineering backlog and sits there.
It is vital to track how long it sits there.
This is the implementation lag time. The amount of time an experiment takes to be added into production from the moment it is deemed successful or valuable.
The clock is counting and every day that goes by without it being in production is a loss in the potential uplifts.
This becomes really important if you’re struggling with getting engineering resources for your experimentation program and need to prove value to your stakeholders.
Action: Number of impactful insights gathered
Whilst it might be easier to report on metrics and stats, the trickier part is reporting on experiments in a way that makes sense to stakeholders. You have to make it easier for them to digest the information and take action on it.
This is where we advocate creating simple 1-2 sentences about the insight itself. Rather than wrap it up in jargon, the insight must inform in the simplest sense of the word without overcomplicating it for the end reader.
For each experiment, you will have collected several insights. Some of these will have greater business impact than others.
The aim of your experimentation program must always be about learnings (even though winning sounds easier). If you can translate these learnings and insights into clear business impact, you will have greater engagement.
Be wary of your teams making this is a numbers game where you can simply embellish the number of insights gathered. Create a guardrail where the impactful insight is vetted and verified to be classed as one.
Action: Decisions made from insights
Extracting the learnings and insights from experiments is only the first step. What should those insights help with?
Better decision making.
Keep a close eye on all the decisions made as a result of your research and experiment insights.
To track this datapoint, you will need to be aware of all the decisions being made that are related to your experimentation program
Want to download a cheatsheet of Experimentation Program Metrics
DOWNLOAD NOW
People Metrics
Every experimentation program has an inescapable fact. It is comprised of people. Tools too but it’s the people that run the tools.
Understanding how the people are doing in a program can help you build a clear picture of your organizations potential to grow experimentation across the wider business
Adoption & Activity: % of organization involved in experimentation
If growing the experimentation program beyond a CRO silo or centre of excellence is something your organization cares about, this metric will be very useful to track.
To calculate this metric, you need to first put a number on the potential number of people that could be involved in experimentation. Bare in mind that in any organization, you will find that not everyone could be involved. Make a note of all the immediate and wider teams that would be involved in running their own experiments or part of the process.
Divide the number of people currently actively testing with that potential number and get a percentage of that.
This % will fluctuate every month as new potentials join the list whilst others leave the company or move to a team where experimentation is not relevant.
Adoption & Activity: % of active individuals
The metric above would have shown you what % of the organization is involved in experimentation.
To get a truer picture, you must look at this subset of people and see what percentage of them are active in experimentation activities.
They must be actively contributing in new ideas, experiments or if they are ancillary or supporting members, are they actively engaging and utilizing the information gathered.
On a much deeper level, you can use a health score to understand the quality of each of these active individuals.
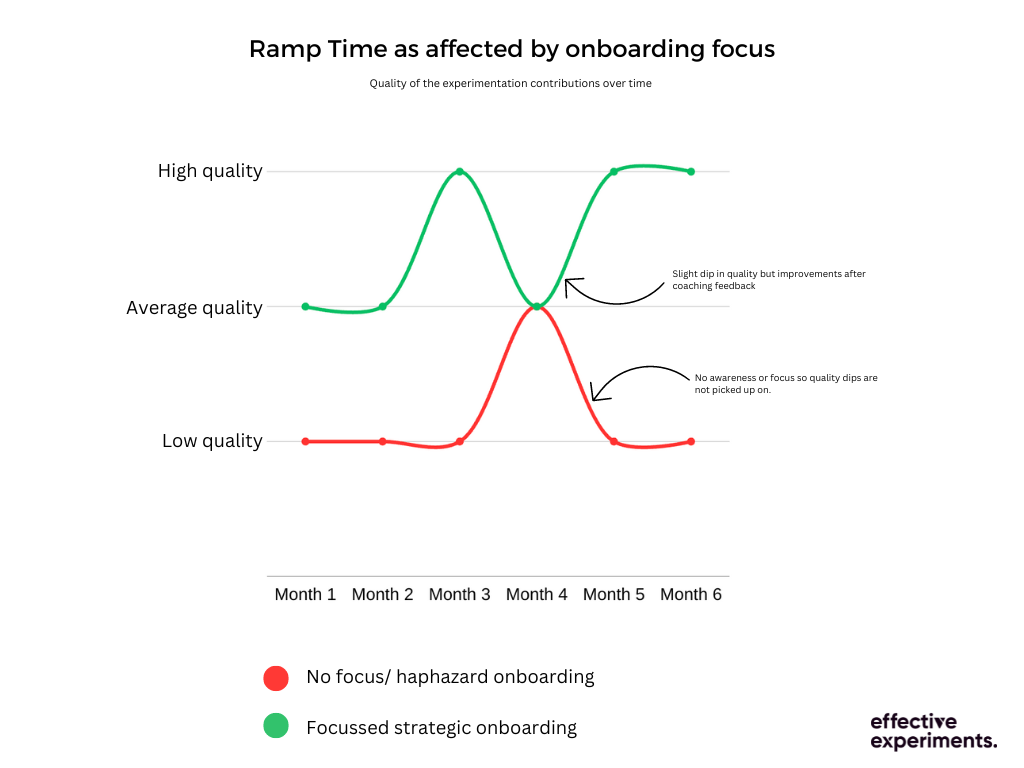
Adoption & Activity: Ramp time
Ramp time is defined as the amount of time it takes for an individual who is completely new to the process to fully adopt the processes in the experimentation program to deliver high quality experiments.
Let’s look at a scenario where a new team has been onboarded and they’re given access to tools along with some basic training. Two months in, this team is still struggling to launch meaningful experiments and the quality of their hypothesis is still poor.
Would you class them as ramped up or fully onboarded? No. They need more training and support.
This is why keeping an eye on ramp time is important.
Ramp time looks at how fast someone can get onboard, understand the historical tests and work done before they joined and embed themselves into the team running at the same quality as those who are already there.
Ramp time is negatively impacted when there are no processes in place, no clear centralized knowledgebase or no training and coaching plan in place.
Engagement: # of views & actions on content shared
All CROs and experimentation teams know the value of sharing the work they carry out. Whether this is via PowerPoint decks, emails or slack updates, they make an error in thinking that the act of sharing is the end of it.
Experimentation teams need to track how many views each piece of content gets (beyond any initial meeting).
This will inform you if people are even looking at the content or not.
If your content is getting a lot of eyeballs, you want to track whether there is any action taken on this content. This could be in the form of new ideas, experiments or other contributions.
Organization-wide engagement cannot be left to chance. It must be actively worked on with internal marketing driving awareness.
This engagement metric will show you whether you are getting any traction for the content you are sharing out there. It is not an easy metric to track especially with the limitations around tracking via emails. It requires a lot of follow ups and persistence.
Engagement: # of new (& quality) ideas submitted by the wider business
Are your ideas only being generated within the CRO silo or specialists teams?
Organizations have a lot of good ideas hidden in parts of the organization that may not be involved directly in experimentation. This could be a customer support team, for example. They talk to customers on a regular basis and could provide deep insights and ideas that could be added to your experimentation backlog.
Tracking the submissions from teams such as this and stakeholders, you could measure the engagement within the wider business.
Don’t stop at number of ideas alone. Vet these ideas and determine if they are experiment-worthy and good quality.